Normality or Fractality?
Are Financial Markets normal? Do they exhibit a pattern? Do they react in a normal way to news/ events? Can the events during the market turmoil of 2008 be described as Normal? How about Brexit? How about US presidential elections? Were those Normal events?
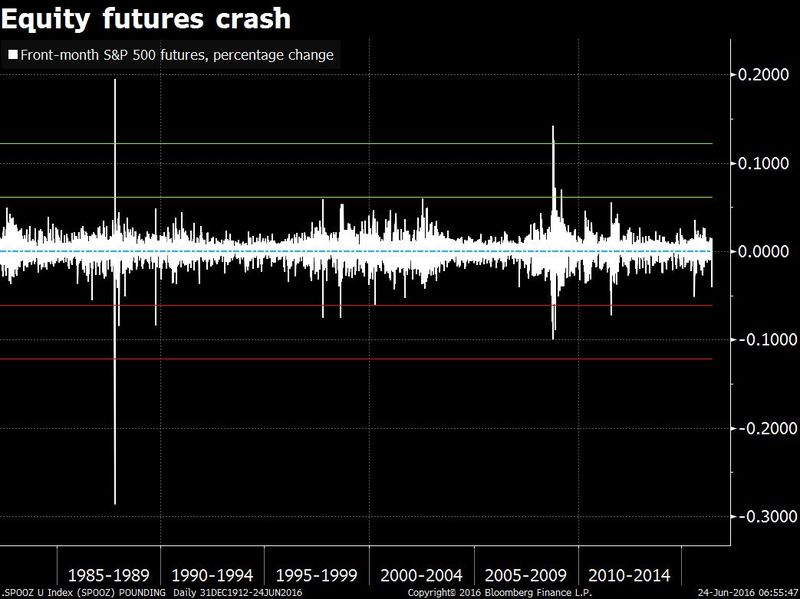
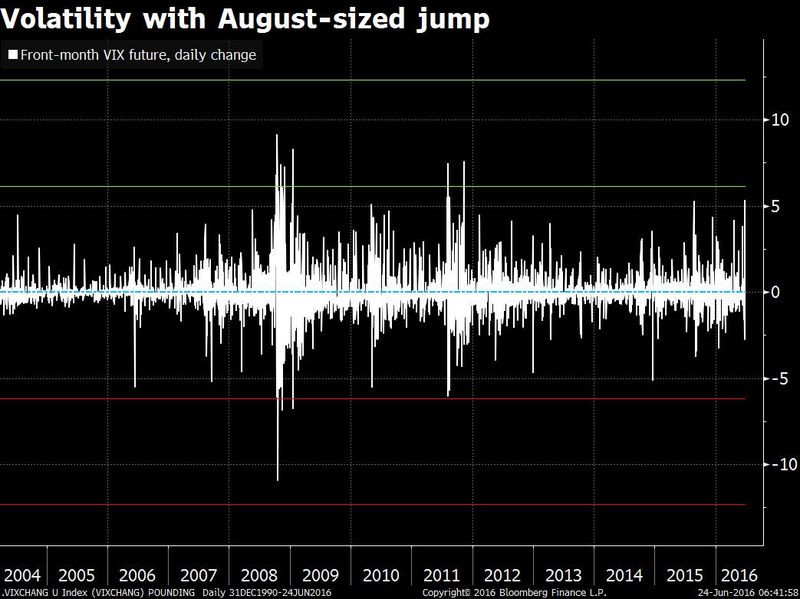
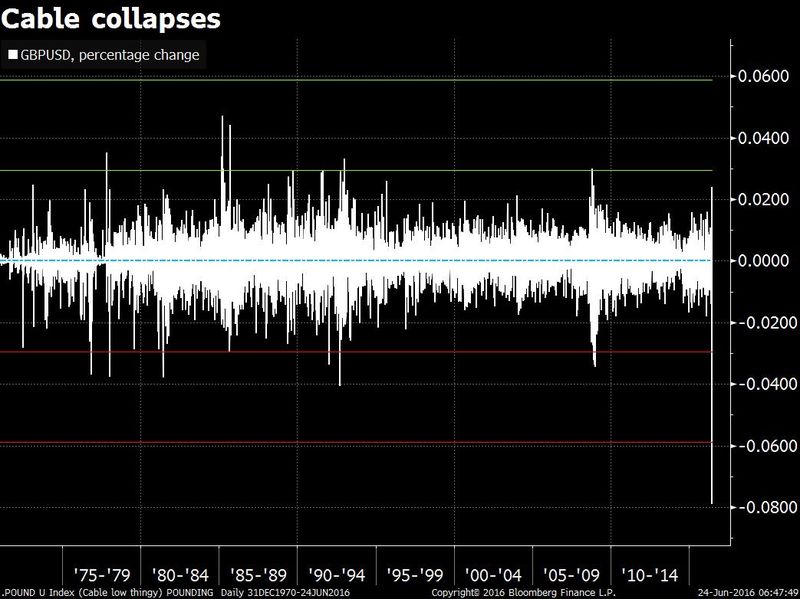
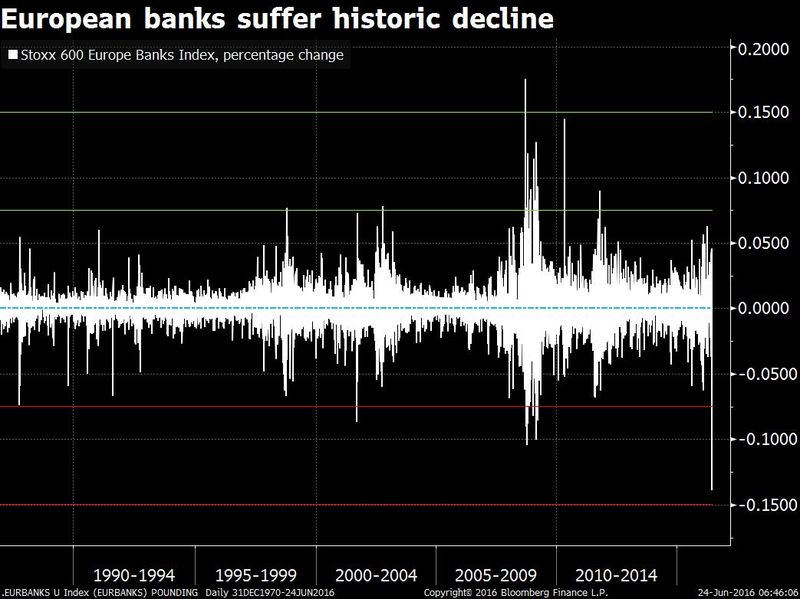
In just couple of lines, I used the word “normal” quite a few times just to make one important point. The normality is out of order. In the financial markets, extreme event are becoming more frequent these days. As seen during the times of the Sub prime crisis, 10 sigma events became frequent. During Brexit June 2016, events as extreme as 18 sigmas (USDGBP pair) occurred. The traits of fat and long tails are quite common. And Financial markets are far from being Normal.
The recent Brexit events are not any different. Markets across all asset classes went haywire and the fluctuated to a greater extent.
Then why do we use a Normal distribution for price returns? It may be accurate 95% of the times, but the rest 5% can make an investment completely worthless. Just like ‘a sailor wont take chances if he/ she knew that weather is going to be moderate only 95% of the times’, why should we settle with an approximation which may be accurate ONLY 95% of times?
Fractals and Finance
Is there another tool which can be used to observe financial markets and which can explain the so-called ‘acts-of-God’ in a better way than identifying them as mere ‘Black swans’. Benoit Mandelbrot, the father of Fractals, spent his entire life in observing complexities and singularities in various fields. Driven by complexities in nature, he chose to find a pattern in that complexity and thence evolved Fractals.
So what exactly are Fractals? Simply speaking, Fractals are self-similar structures that repeats themselves at every scale. In nature, we see it but we don’t observe it. A leaf exhibits fractal properties. The leaf in the below image contains many smaller leaflets . You zoom in further, you see a similar leaf. This goes on and on.

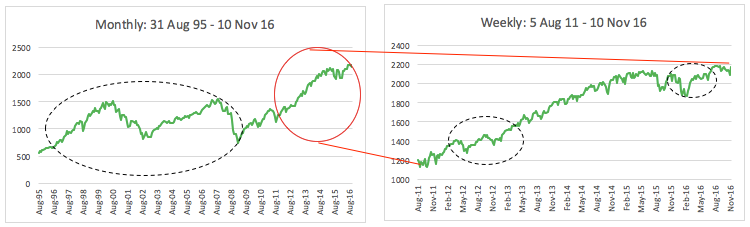
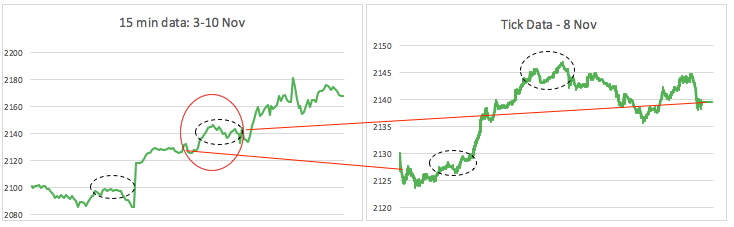
Can a similar trend be seen in Financial markets? Or has it been seen already? Let’s take a look at S&P 500. The traits of similarity are clearly seen from monthly to weekly further down to tick by tick information. Inevitably, S&P follows a pattern although complex and chaotic for a Normal behaviour, but Fractals describe it as self similar (or self affine) structures.
Note: The black highlighted are the self similar (self affine) patterns at different scales.
Can the ‘age-old’ Normal distribution define it? No.
Is there a pattern here? Yes. Financial markets very commonly exhibit these self affine features.
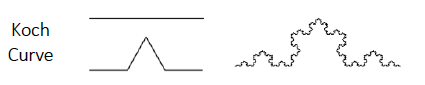
Self-similarity (or affinity) isn’t the only cool feature of Fractals. It gives rise to Fractal dimensions, dimensions which are not defined in Euclidean space. A point, for example, doesn’t have any dimensions; a line is 1-D, a cube is a 3-dimension structure. What about a Koch curve (or a snowflake) or Cantor dust? A repetitive information in Koch curve makes it more complex than 1-D figure but its not exactly a 2-D structure. Fractal geometry gives it a dimension of 1.26, a fractional number.
Can this be applied to Financial markets? The short answer is yes. (The long answer is that a whole new fractal geometry can simulate financial markets)
Benoit Mandelbrot, in his revolutionary paper on Multifractal Model of Asset returns(MMAR), talks about this dynamic Fractal dimensions in detail. Mandelbrot presented the below image in his article “Multifractal walk down the wall street”, and asked the readers to differentiate between various time series.
The quiz posed was: ‘Out of the below 8 time series, which one is a real market data (price returns), and which ones depict artificial models’ The artificial models used in this quiz were:
- GBM: a random walk,
- Fractional Brownian Motion, fBM: extension to GBM and exhibits long memory
- Levy Stable: Exhibits extreme events, i.e. fat and long tails
- MMAR
(The solution to this quiz are mentioned in the paper: Multifractal walk down the wall street). An interesting thing that was presented was the similarities in MMAR and actual price returns, and how challenging it is to distinguish between a MMAR time series and real market data.
The Future?
Fractals, and further fractal geometry, has proven its place in various segments. Be it Fractal antennas for a better and faster communication, or Prediction of cardiac arrest by fractal analysis of heart rates. Be it the distribution of galaxies or the distribution of price returns in financial markets. Fractals are everywhere.
However, do we use it now in financial industry? Although first pioneered in late 90’s and further developed throughout first decade of 21st century, Fractals still have a long way to go before making its mark into a full fledged financial industry. Major Banks and Financial institutions haven’t delved in detail into Fractal Finance. However, few individuals and proprietary firms have applied this field of mathematics to gain a more clearer insight of the industry.
It is just the matter of time that market practitioners realise the importance of Fractals in Finance. This part of mathematics has a huge potential ranging from a better forecasting to improved Derivatives Pricing models. It can further be applied to develop Trading strategies across asset classes or various factor based models. With plethora of usage, Fractals can definitely pave a new way to analyse financial markets.