Biases and Preferences in the Indian markets
The last article was an attempt to breakdown Indian markets into various regimes. The regimes bifurcated the market behaviour and central bank’s responses within each regimes.
Regimes can play an important role while making mid to long term investment decisions. In this article, the focus will primarily be on how markets performed in individual regimes.
Regimes - A quick recap
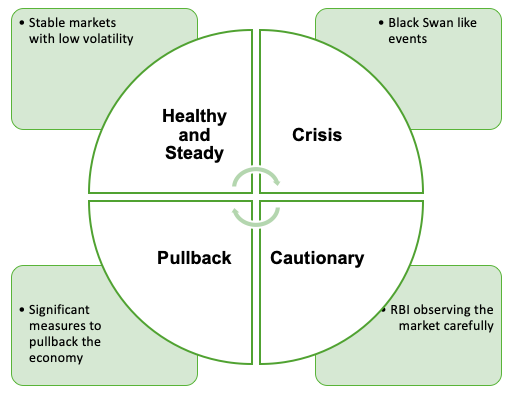
I had described earlier Indian markets into 4 regimes. As a quick recap, here those regimes are:
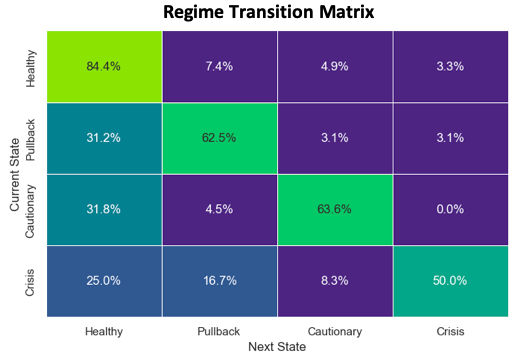
Once the market is in Crisis state, there is 50% chances that the market stays in the crisis mode. This indicates that crisis isnt momentarily. It takes a while for the market to recover. Once the recovery starts, being in the cautionary mode, it is likely to stay there for a while.
In the subsequent sections, we will analyse how different factors, asset classes performed in individual regimes.
Market Performances
1. Core Market Breakdown
| Average Monthly Returns | Average Monthly Volatility (annualized) |
|---|---|
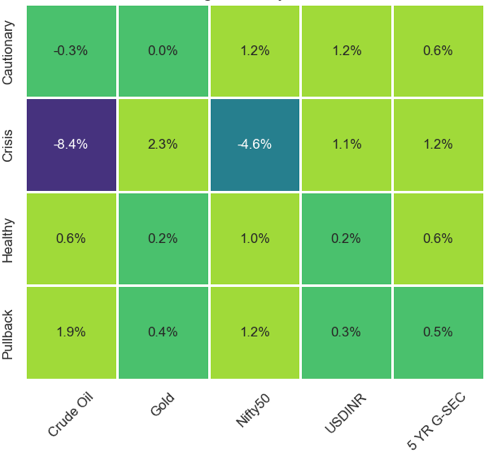 | 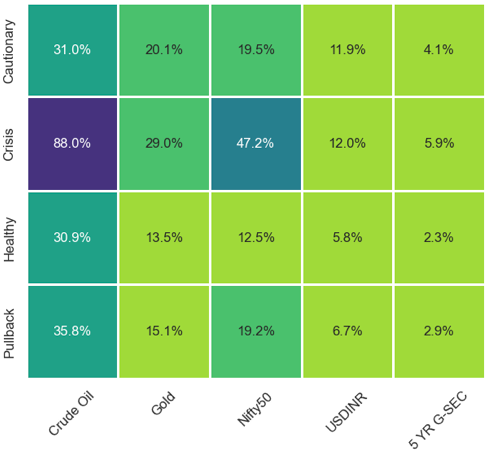 |
As expected, during the crisis times, investors rush towards safe havens. Gold and Government Securities provide the best support during these times. Crisis isnt the right time for Equities market in general. Broad Nifty 50 Index crashed more than 4% on an average in a month, while being extremely volatile. During such times, INR also depreciated against US Dollar. Crude Oil futures have fared extremely poor during the times of market crash, in general.
Cautionary times exhibit okay returns but being in a watchful mode, markets are a bit volatile.
2. Breakdown by market capitalization
| Average Monthly Returns | Average Monthly Volatility (annualized) |
|---|---|
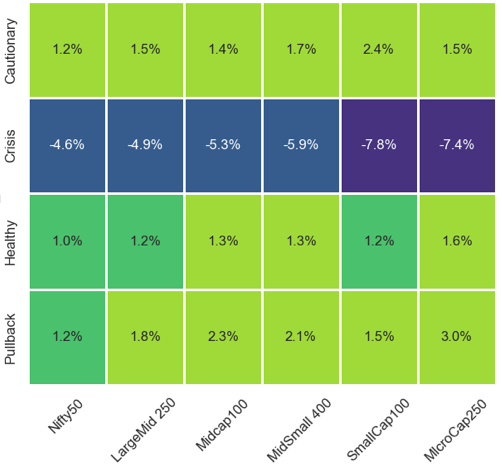 | 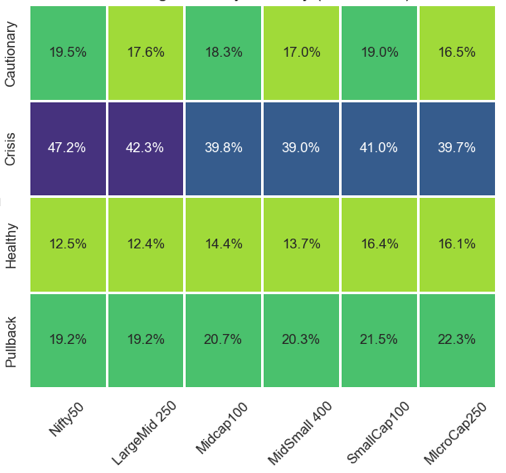 |
Equities is further broken down by market capitalization. While it is clear that crisis isnt good for Equities in general, there are Small caps and micro cap companies which perform extremely poor than their peers during such times. Both Small and Micro cap fell by over 7% monthly.
3. Sectoral Performances
| Average Monthly Returns | Average Monthly Volatility (annualized) |
|---|---|
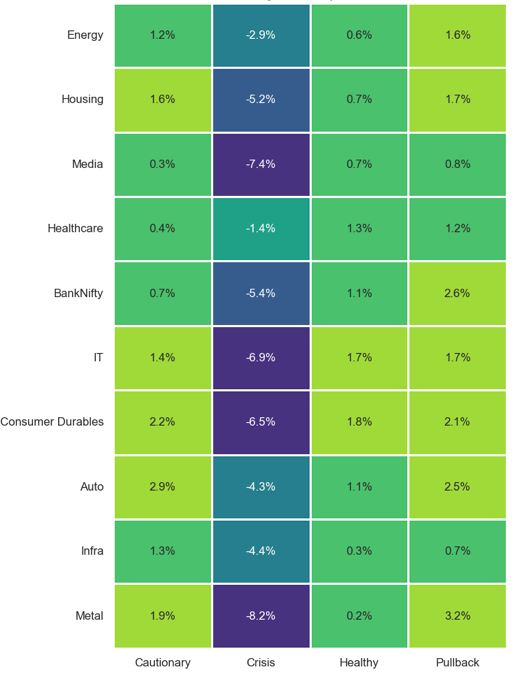 | 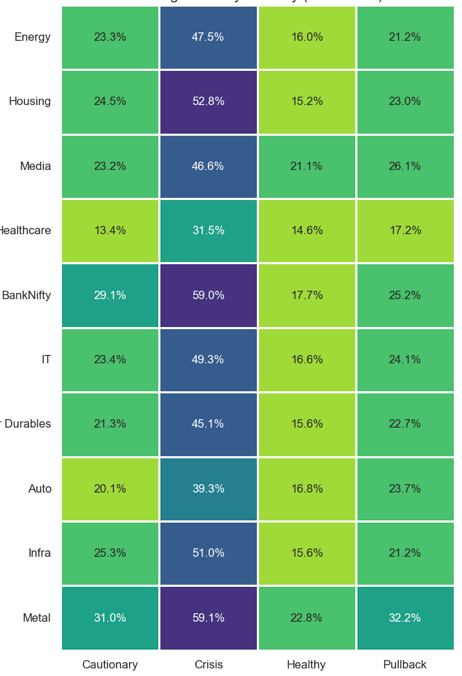 |
Metals, Media, Information Technology and Consumer Durables are badly hit during Crisis times. All of these sectors fell over by 6% monthly. On the other hand, Healthcare and Energy have fared relatively better during such times, falling not more than 2% and 3% respectively.
When the pullback happens, banking sector out shines its peers. Major push by RBI by rate cuts lead to higher borrowings in the market, leading to a larger loan book building exercise for the banks. Such times are also good for higher capital requirement related sectors such as Metal, Housing, Autos etc, as they focus on project completions or embark upon new projects.
4. Equities Strategies
| Average Monthly Returns | Average Monthly Volatility (annualized) |
|---|---|
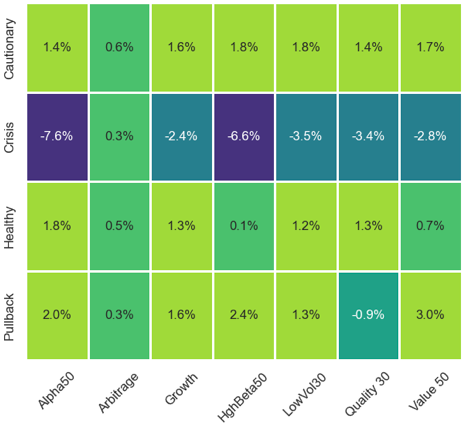 | 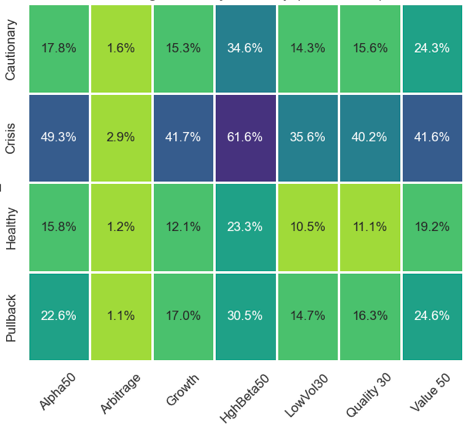 |
Let’s look at individual Equity Strategy in a nutshell, and assess their performance during different regimes. Detailed desription of each strategy can be obtained here.
Alpha 50 Index: follows a structured, quantitative approach that assigns weightage to securities based on their alpha values. This means that stocks with higher alpha values (higher returns than broader market indices) receive greater weight in the index.
Arbitrage Index: index measures performance of portfolio involving investment in equity and equivalent short position equity futures, short-term debt market investments and cash.
Growth Index: index contains selective growth securities with higher Price/ Earnings and Price/ Book ratios than Nifty.
High Beta Index: index aims to measure the performance of the stocks listed on NSE that have High Beta. Beta can be referred to as a measure of the sensitivity of stock returns to market returns.
Low Volatility Index: index aims to measure the performance of the low volatile securities in the large market capitalisation segment.
Quality Index: index composed of securities selected based on their ‘quality’ scores. The quality score for each company is determined based on return on equity (ROE), financial leverage (Debt/Equity Ratio) and earning (EPS) growth variability analysed during the previous 5 years
Value Index: index composed of securities selected based on their ‘value’ scores. The value score of each company is determined based on Earnings to Price ratio (E/P), Book Value to Price ratio (B/P), Sales to Price ratio (S/P) and Dividend Yield.
Arbitrage Strategies have been the most consistent of all. A steady return of 0.3-0.6% every month irrespective of the market regime, and that too at an extremely low volatility makes them the strategy for all seasons.
High Beta and Alpha are more prone to major fallouts during the times of crisis. These strategies fare better than their peers during a healthy market and a pullback economy.
While comparing Growth Vs Value stocks, Growth is favored during a healthy market state, whereas Value stocks are preferred during a market pullback.
Conclusion
This article examined Indian market performance in varying regimes across multitudes of dimensions, ranging from asset class, market capitailizations, sectors to Equities Strategies.
Clearly markets have preferences and biases. There is hardly any sector or asset class which is suited for all weather. This makes portfolio rebalancings and diversification quite an important part of the whole investment process.
Crisis favors safe havens such as G-SECs or Gold; whereas healthy markets calls out for Lower Cap stocks, while favouring Alpha strategies.
Appendix
References
PS: For detailed python notebook, you can reach out to me directly!
Disclaimer: The article is solely made available for educational purposes and doesn't promote any investment or trading guidance whatsoever. Any views or opinions presented in this article are solely those of the author.