Machine Learning approach to understand Indian market regime
If you have been active or even moderately active in the financial markets, you already know that markets are not same all the time. There are times of a bull run, when equity markets shine, you cost of borrowing is cheap. And, then there are times when everyone is trying to get out of the market, a huge sell off. Just like during the times of Financial Crisis in 2008, or even during the pandemic in Feb-Mar 2020.
This article is an attempt to understand the so-called regimes from the context of Indian markets. Furthermore, this article offers a data-driven and systematic approach to identify which regimes the markets have been and where it is right now.
Regime Identification
There is no hard rule on defining the market regimes. Research by Two Sigma segregates the market into 4 different regimes. There are other studies which define regimes in different fashion.
There can be various ways of identifying which regime the market is in. Practitioners, typically, analyse macro level data such as how the Equities market is performing, along with GDP Data, inflation levels etc, and then determine the market regime. Ofcourse, there are more complexities involved. Invesco has shared a well articulated article on how they tried to identify different business cycles in the market.
In this article, I will be taking an inspiration from the Two sigma’s approach of 4-regime market. This approach is data-driven and algorithmic in nature. We will be applying the technique of Gaussian Mixture models (GMM). GMM is a type of unsupervised learning technique which assumes that provided features uses normal (Gaussian) distributions.
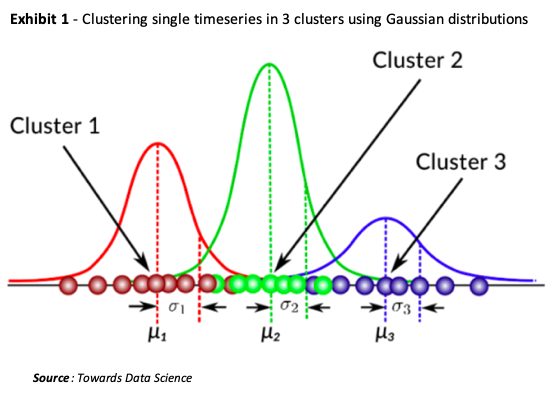
The GMMs use various gaussian distributions to model different parts of the data. Assume that in the above exhibit, the timeseries represent the Nifty 50 monthly returns. The left tail (Cluster 1 ) may represent the down market scenarios. On the other hand, the middle section (Cluster 2 ) may indicate the times when market movements werent huge. This way, we can easily break down the Nifty50 returns into 3 regimes.
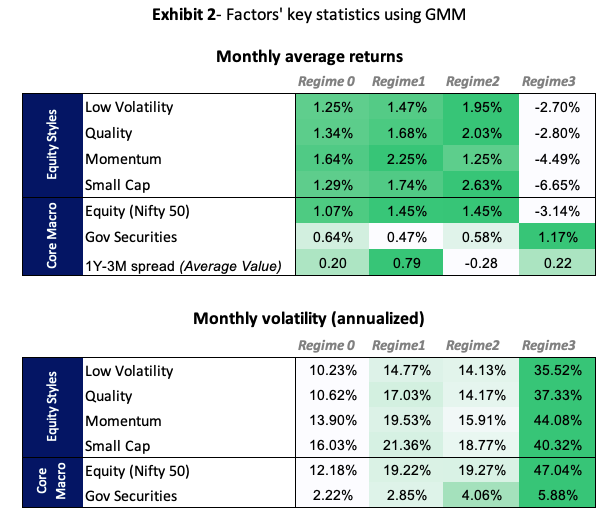
Expanding this analogy onto our analysis, instead of just taking the Nifty50 returns, we will dig deeper and consider different market factors. Besides the Core Macro Equity factor (Nifty 50), we will also look at how other asset classes such as currency, rates have fared during different regimes. Breaking down the Equity market further into different styles can provide some insights on performances during different regimes.
Any machine learning classification model can only provide you the distinguishing classes. It, however, can not suggest the underlying meaning of the class. GMMs are no different. The model segregated the time series into 4 regimes, however its now upto us how we interpret these regimes.
Market Regime 0 - Healthy & Steady
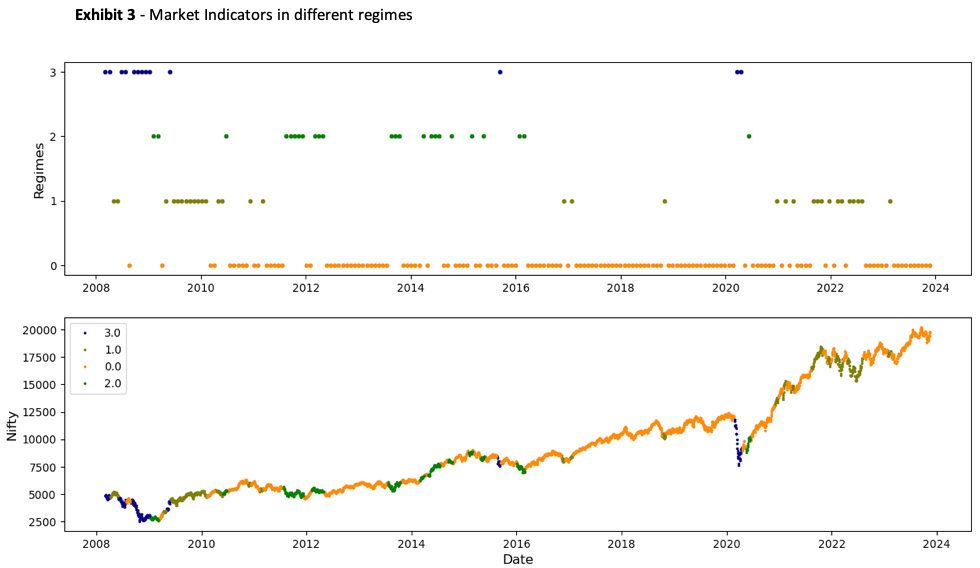
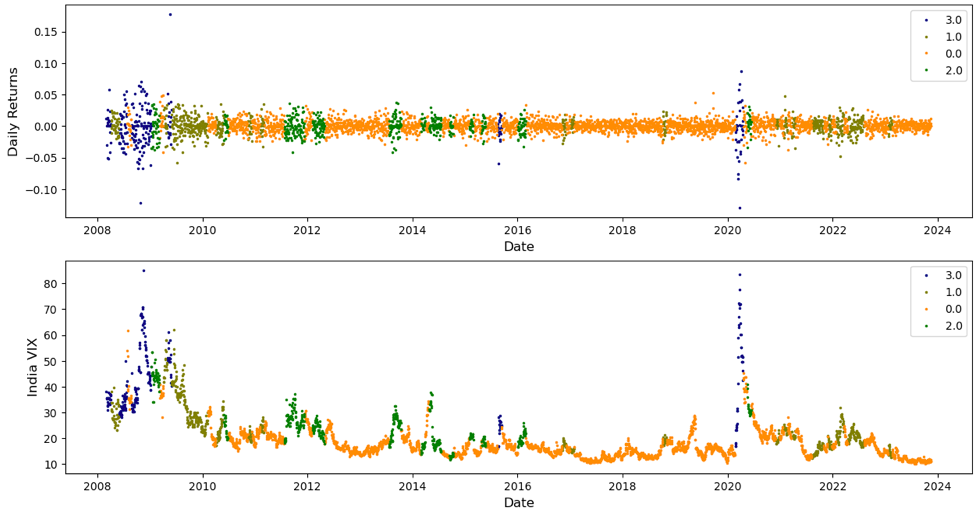
Highlighted by Orange, In this regime, markets have been quite calm. Broad Equity market along with individual style factors exhibit low volatility. This is further validated by lower VIX levels on an average during this phase.
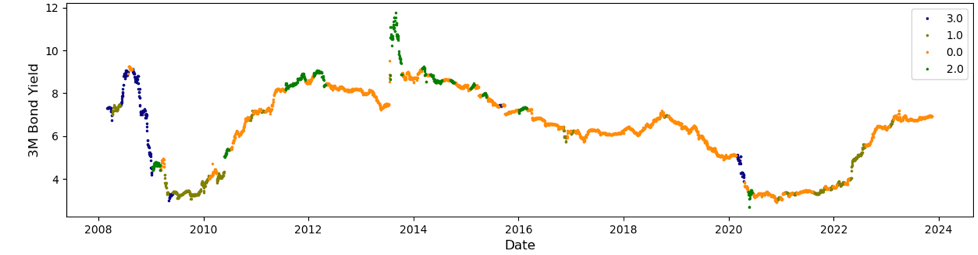
Exhibit3 - 3 Month Bond Yield plot indicates how the short term rates transitioned. In the bullish times of 2014 till the onset of pandemic, the 3-month yields gradually lowered, making the short term borrowing more cheaper. Small cap and momentum factors outperformed the Nifty 50 Index.
Overall, this is a healthy and steady state of the market with all macro factors and varying styles performing well on average
Market Regime 1 - Pullback
In this regime, Equities market performed moderately averaging nearly 1% monthly returns. This, however, is mostly driven by Quality stocks, and low Volatility stocks. Small cap, on the other hand, showcased relatively lower performance.
Yield spreads widen up during this regime (1Y-3M averaging nearly 80 bps whereas 10Y-3M going above 250 bps). This is majorly driven by lowering of the short term rates in an effort to pull back the economy.
Such regimes usually occur after a major negative market event, in which focus is primarily on pulling back the economy.
Market Regime 2 - Cautionary watch
A neutral market performance in this regime, and a slight push by the Value and Quality styles indicate a careful market. Investors are going towards safer havens in the search for returns.
There is a slight inversion on the shorter end of the yield curve with 1 year yield going below the 3M yields by 26 basis points. The longer end is getting more flattish, with 10Y-3M spread going as low as 5 bps. Short term rates are not yet lowered completely. This is a potential sign of central bank (Reserve Bank of India), carefully observing the market conditions before taking any drastic measures.
In some of the cases, this regime can be followed by the pullback (Regime 1) if the extent of careful indicates a negative sentiment in the market.
Market Regime 3 - The Crisis
These are one of the most interesting times for investors. Most of the factors exhibited negative performances on average. Within individual style factors, small caps lost almost 1.5 times as much as broad based equities. Equity Low Volatility factor garnered a negative return as compared to other regimes, on the account of higher volatility. Momentum also suffered badly here.
In the search for returns, investors herded towards government securities which garnered a positive monthly return of over 1% while equities market was reeling.
Such regimes do not occur frequently, but demonstrate the extreme nature of the financial market which happens once in a while.
The order of Regimes
These regimes dont occur randomly. They tend to follow a certain order. Markets continue to stay healthy and in steady state for as long as they can until a drastic event occurs. The pandemic like situation or the Financial Crisis is easy to break the market’s momentum and move the finanical markets into the state of Crisis. The crisis continues for a while, and the central banks and investors observe it carefully. A state of caution is very much needed here. Once the crisis like situation is over, central bank intervenes and starts pulling back the economy with all the tools in their arsenal.
The economy recovers, and then continues to be in healthy state with minor hiccups every now and then, and the whole cycle continues.
Conclusion - What it means to Investors
Day traders may not look at the market regimes as closely as a mid term or a long term investor would do. Asset Allocation decisions become quite important while constructing portfolios or even during portfolio rebalances. There have been many studies and use-cases where researchers have tried to predict the market returns. An extension of this would incorporate the prediction to regimes.
For a mid term investor/ manager, it would be interested to understand how likely it is for the market to stay in a healthy state for the next 1 year. Or where does he/ she see the market to be in after next 5-6 months. The understanding of the current regime and the prediction for the next will help make a well-informed decision.
Appendix
References
- A Machine Learning Approach to Regime Modeling by Two Sigma
PS: For detailed python notebook, you can reach out to me directly!
Disclaimer: The article is solely made available for educational purposes and doesn't promote any investment or trading guidance whatsoever. Any views or opinions presented in this article are solely those of the author.