[Momentum Investing] Part 4 - Construction of a better Portfolio
This is the last article in the Momentum series. The first article, Momentum in India talked about how Momentum Investing has fared in India, and a bit of history about it. We also covered how Equity Momentum compares with other factors and asset classes’ performance.
The second article in the series, The Base Momentum Portfolio touched upon a basic Momentum Portfolio with a naive trend filters. We introduced the impact of rebalancing frequency and also how analysed how rebalancing in middle of month is better.
The 3rd article, Risk Management & Portfolio Construction was all about risk management. Stop Loss, along with asset diversification helps in reducing portfolio volatility. This is already a known fact, but how different stoploss factors impact the performance is also important. Besides, we tried different asset allocation schemes such as Maximizing the risk adjusted returns every month. Lastly, we identified how introduction of earnings momentum significantly improved the portfolios’ metrics.
In this article, the last in this series, we will incorporate all the features we analyzed previously, and will incrementally construct the portfolio. So, warm up your coffee, sit upright and start!
The Incremental Portfolio Construction
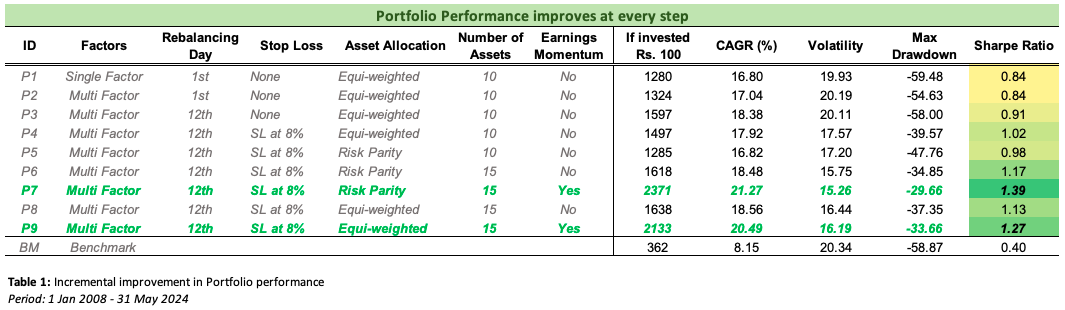
We start with our base portfolio with a single factor, 12M returns trend (skipping last 1 month), and rebalancing on 1st of every Month with No Risk Management what so ever. This is the base portfolio we created in 2nd article. This portfolio, performed better than our Nifty 50 Index, both in terms of Risk adjusted returns (Sharpe) or pure returns. However, this portfolio had a drawdown of nearly 60%, occured during the Great Financial Crisis.
The introduction of another factor (3M returns), making the portfolio a Multi factor, slightly improved the CAGR, without much improvement in the Sharpe ratios.
A major improvement appears when the rebalancing day shifts from 1st every month to 12th of every month. CAGR jumps by over 150bps, while Sharpe improved to 0.91. See table 1 for more details.
So far, there is no Risk Management in place. A basic Portfolio Stop Loss of 8% drastically lowers the drawdown of the portfolio. From earlier 60%, drawdown comes down to 39.5%. We see the sharpe now going above 1.
Asset diversification further pushes the Sharpe forward, to nearly 1.2. Now we have 15 assets in our portfolio providing more diversification benefits.
Lastly, adding Earnings Momentum as another factor not just improves the CAGR but also lowers the risk. Portfolio drawdown has lowered down to 30% and volatility has reduced to 15.2%. With a sharpe of nearly 1.4, this is a drastic improvement on our base portfolio which had a sharpe of 0.8.
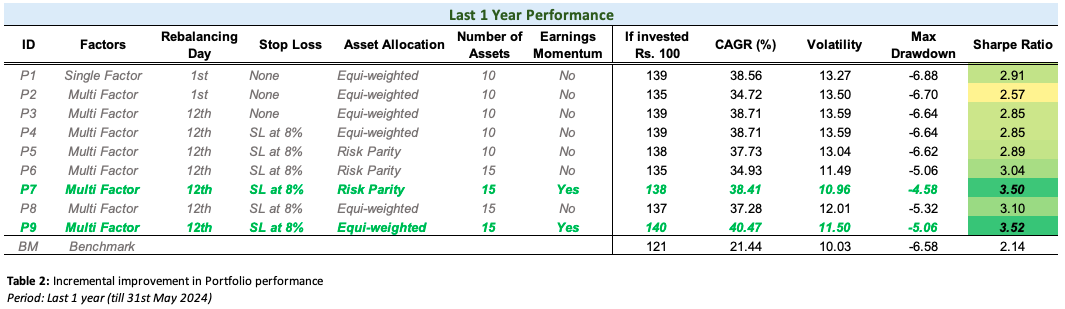
Table 1 summarizes the above details for the entire backtesting period, whereas Table 2 demonstrates it for last 12 months, i.e. period ending on 31st May 2024.
Figures 1 and 2 illustrate the Risk Vs Returns of all our portfolios. Clearly, P7, which is the enhanced portfolio stands out with higher CAGR and lower risk (in terms of Volatility and Drawdowns)
Lastly, we show the Historical Performance of all the portfolios. A bit too overwhelming to see all in one chart, but it is quite clear that the incrementally constructed portfolio has outperformed the prior portfolios consistently.
Potential ideas for Future research
This series was quite a learning for me, and I hope the same for the audience as well. The tricks and approaches applied throughout form the basics of Systematic Portfolio Construction and Investment Management. Momentum has been the poster figure of factor Investing in India in last few years, and with our analysis, we dug into more deeper insights of how a better Momentum portfolio can be constructed.
Having mentioned that, there are still many areas in which we can further enhance our portfolios, such as
- We are looking at past Momentum trends to construct the portfolio. An advanced version may use a predictive analysis to figure out potential tickers which may outperform.
- Our Risk Management currently switches to Cash when breach happens. Enhanced versions may include switching over to Treasuries or Government Bonds to earn a stable yield during stress times
- A multi factor approach can be more advanced by introducing an optimized factor allocation which may garner benefit from factors suitable for a particular market regime.
- We havent considered the impact of Taxation. Currently in India, there is a flat 15% tax on short term capital gains. However, we may apply an optmized tax rebalancing to reduce our tax liability
…. And the list goes on.
Till then, Stay tuned for the next research!
Appendix
- Research Details & Source: Project Quant, by Ankit Gupta
PS: For detailed python notebook, you can reach out to me directly!
Disclaimer: The article is solely made available for educational purposes and doesn't promote any investment or trading guidance whatsoever. Any views or opinions presented in this article are solely those of the author.