[Momentum Investing] Part 2 - The Base Portfolio
In the previous article was all about the History of Momentum Investing in India, and how does it fare with other style factors. In this article, I will outline different implementations of a Momentum strategy, and study the historical properties of a range of simple Momentum strategies (prototype factors). In addition to Historical properties, we will compare how this base prototype fares with other variations in our base selection.
Base Momentum Fund - The Prototype
Portfolio Selection
Designing the fund entails, selecting the underlying assets, choice of metrics used to identify Momentum, as well as technical implementations such as rebalancing frequency, transaction costs etc. The selection of assets is done on a relative basis, called Relative Momentum Strategies,
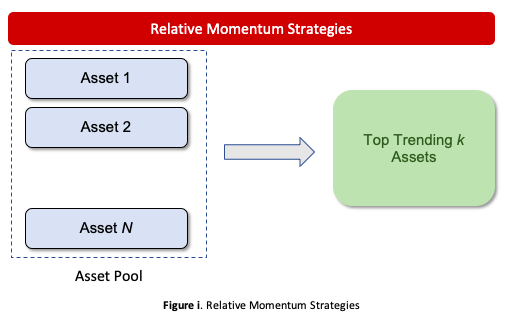
To construct and test Momentum Strategies, we would take top 10 stocks from Nifty 50 Index every month, with Equal Weightage assigned to them every month. We assume a cost of 14 bps on every transaction, which is inclusive of all transaction cost, brokerage fee and taxes on NSE. We will construct the base prototype with 12 month lookback window for the momentum indicator, i.e. identifying stocks with best returns in the last 12 months, skipping the recent 1 month to avoid the “reversal effects”, as shown by Jegadeesh and Titman (1993). The portfolio’s performance will be compared with Nifty 50’s performance during the time. In addition to 12 month Momentum indicator, I will construct 1-, 3-, and 6- months indicators.
The portfolio will start from 1st Jan 2008, the year of Global Financial meltdown. As seen above, I expect the base prototype not to perform better that year.
NOTE: There is a survivorship bias, as latest Nifty 50 constituents are used to construct Momentum portfolio in the past.
Performance Study
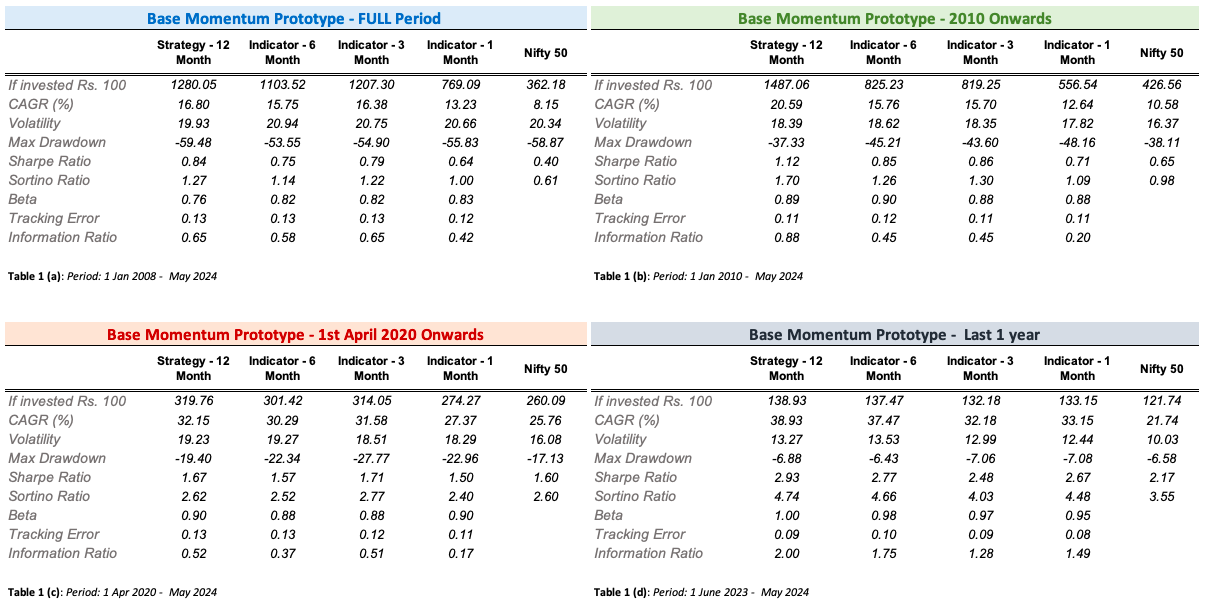
The performance usually erodes as the time horizons for calculating the trend signals get shorter. On a full Backtesting period from 2008 onwards, the 12-month Momentum signal yielded a CAGR of nearly 16.8% whereas 1-month signal underperformed with CAGR of just over 13%, still better than Nifty50. The numbers drastically change when the model ran from 2010 onwards, i.e. removing the Financial crisis times. 12-month momentum signal generated CAGR of 20.6%, whereas 6-month and 3-month signals merely reached 16% CAGR. On risk adjusted basis, still longer duration momentum signal outperformed others as well as Nifty50. Since the onset of Covid, Momentum Base porfolios have given CAGR of nearly 32%, better than Nifty’s 25%
1. Trend Signals
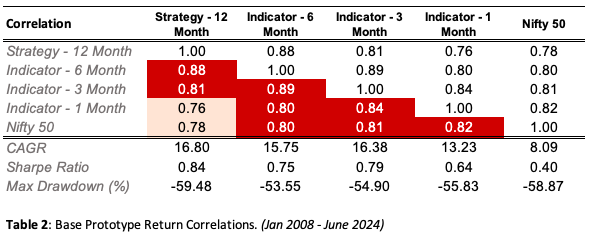
In our base portfolio, we chose a standard Trend signal which looks at past X months returns, and picks the top 10 assets every month based on thhe “momentum” score. As above, we tried variations of “X” months, in the form of 12-month, 6-month, 3-month and 1-month. However, all these signals tend to behave in a similar fashion, i.e. they exhibit strong correlations.
Other Possible Trend signals?
- Returns(d1): Tried already. Compares current price level with that d1 days ago
- Moving Average(d1): Moving average trend indicator, comparing today’s price with either d1-day simple or exponentially-weighted average price
- Risk Adjusted Returns(d1): Compares the historical d1 days returns with past d1 days annualized volatility.
- Moving Average Cross Over(d1,d2): A technical trend indicator that compares d1 day moving average with d2 days moving average, d1: long window; d2: short window
- Moving Average Convergence Divergence(,d2,d3): MACD technical indicator, extensively used to identify Momentum trends, d1: slow window; d2: fast window; d3: sign window
- Linear Combination: Linear combination of multiple trend indicators to generate a consolidated indicator
- Non-Linear ML Based: A machine trained indicator which identifies momentum trends
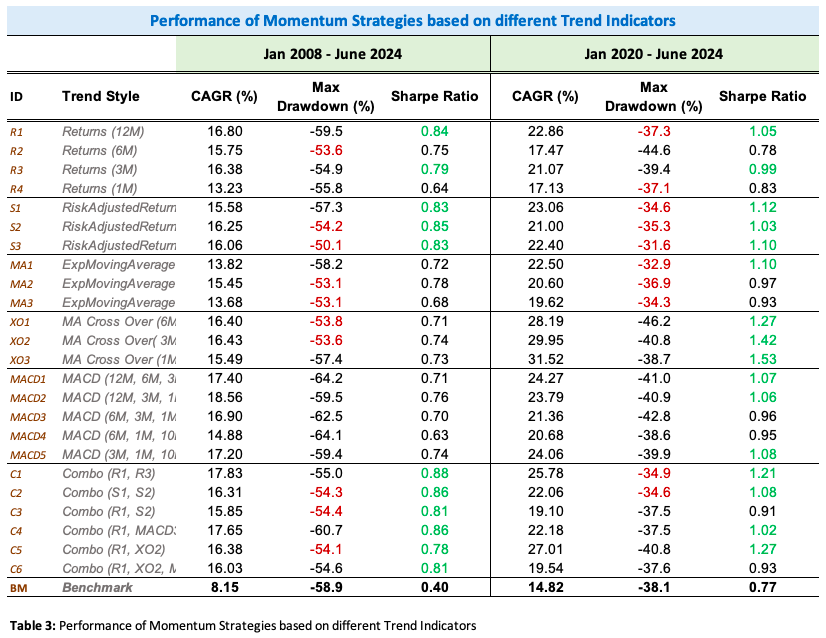
Table 3 highlights the findings for different trend Indicators. Looking at the full backtest horizon since 2008 and only the CAGR, the best strategy came out to be based on MACD Indicator or a Linear combination of different indicators. Though they suffered from higher Volatility and higher Drawdowns. From Risk adjusted basis, as expected, Risk adjusted returns Indicator based performed relatively well, along with the linear combination based indicator. In a relatively shorter time frame, since 2020, most of the Momentum strategies generated Sharpe over 1, significantly higher than what Nifty presented. The high drawdowns, ofcourse, can be attributed to the Covid 19 period.
Important point to be noted from these findings is that a combination of indicators may work better than a single indicator as there are possibilities of diversification from these indicators.
2. Rebalancing Frequency
So far, we have just talked about rebalancing every month, and that too on 1st of every month. Is it the most optimized way? In this section, we will analyse varying rebalancing frequencies and days of rebalancing.
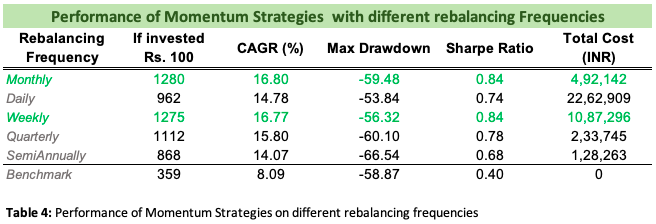
Monthly rebalacing and weekly rebalancing have been the best performaing strategies with our base Trend indicator. Both of them generated a CAGR of nearly 16.8% and sharpe over 0.8. Weekly rebalancing, however, incurred a significantly high transaction costs throughout the backtesting time. We have considered a totat cost of 14 bps on every transaction. Weeklies incurred a total cost of nearly INR 11 Lakh, when portfolio was started with 10 Lakh as initial value. As the rebalancing frequency goes down, the transaction cost also goes down.
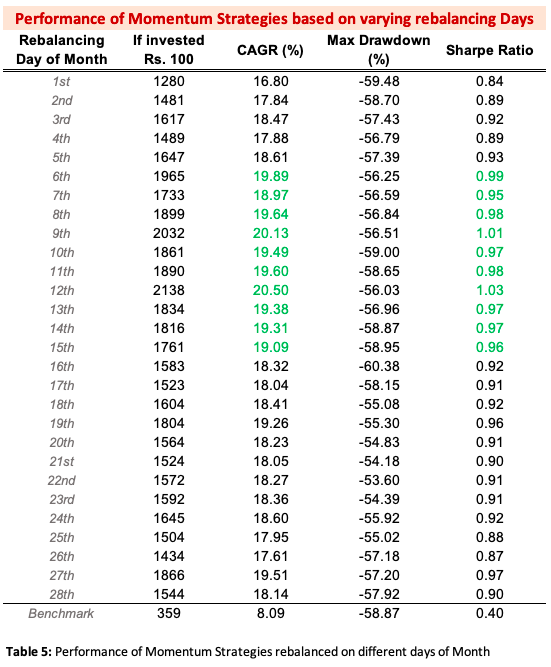
So far, in all the above experiments, we have rebalanced on the 1st of every rebalancing period. What happens if we rebalance on 2nd of every Month or 15th of every Month? Table 5 below shows the performance of Momentum strategies on different rebalancing days, assuming a monthly rebalance. It is clearly evident that rebalancing in the 1st week or last week isnt that beneficial Vs rebalancing in the middle of the month. When we rebalanced between 6th -20th day of Month, the portfolio generated a sharpe of over 0.9, much higher than 0.84 (when rebalanced on 1st day of Month)
3. Impact of Transaction Cost
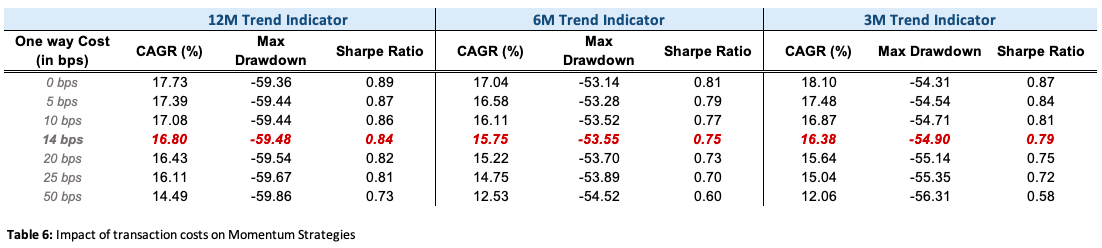
We next analyzed the impact of alternative transaction cost assumptions. Portfolio turnover incurs transaction costs, which eat away strategy performance. With longer signal lookback windows (e.g. 12-month Momentum), transaction cost is generally doesnt seem to be a major concern. For 5 bps increase in costs, the CAGR roughly goes down by nearly 30bps. However, Shorter signal lookback windows have higher impact of transaction costs. For every 5 bps increase in costs, the performance goes down by 60bps.
Conclusion
In this article, we covered the basics of different attributes of the momentum strategy, viz Trend Indicators and lookback windows, Rebalancing frequencies and different days for rebalancing, and how Transaction costs impact the performance. The best performance, so far, has been for a Monthly rebalancing momentum portfolio, rebalancing in middle of month, with 12-month Returns based indicator (can be combined with Risk adjusted returns or MACD).
So far, we havent talked about the risks in this portfolio, and how to address & manage them. At the same time, we havent discussed the basics of portfolio construction. Our assumption of equal weighting to all 10 stocks may be quite naive. Can there be a better metrics possible?
The next article in this series will discuss the concepts of Risk Management and Portfolio Construction of a Momentum Strategy in detail. Till then, stay tuned!
Appendix
- Research Details & Source: Project Quant, by Ankit Gupta
PS: For detailed python notebook, you can reach out to me directly!
Disclaimer: The article is solely made available for educational purposes and doesn't promote any investment or trading guidance whatsoever. Any views or opinions presented in this article are solely those of the author.