India - The dance of Yield Curve
Before I begin this article, I will highlight that I am more of an Equities guy, and exploring the vast possibilities on the Fixed Income side as well. So, if some things don’t match here, kindly take a moment and highlight them.
So, what is this article about? All the time, people talk about the yield curve from a broader economy perspective. How a small change in yield curve represents upcoming possibilities in a country’s economy. I have taken the liberty to analyse the Indian Bond Yield Curve (since 1998), as per data availability, and will highlight the key aspects the curve has shown and how the economy reacted in accordance with it.
First things first, How to interpret the chart.
We have the weekly Bond yields of available India Government Bond maturities since Jan 1998 till 17 March 2019 (a span of over 20 years, source: investing.com).
If the yield points are not connected in the chart, it represents the unavailability of yield point of an intermediate maturity. As we move along the time, Indian government issued bonds of varying maturities, and hence you will see the curve dancing to its full potential in later stages.
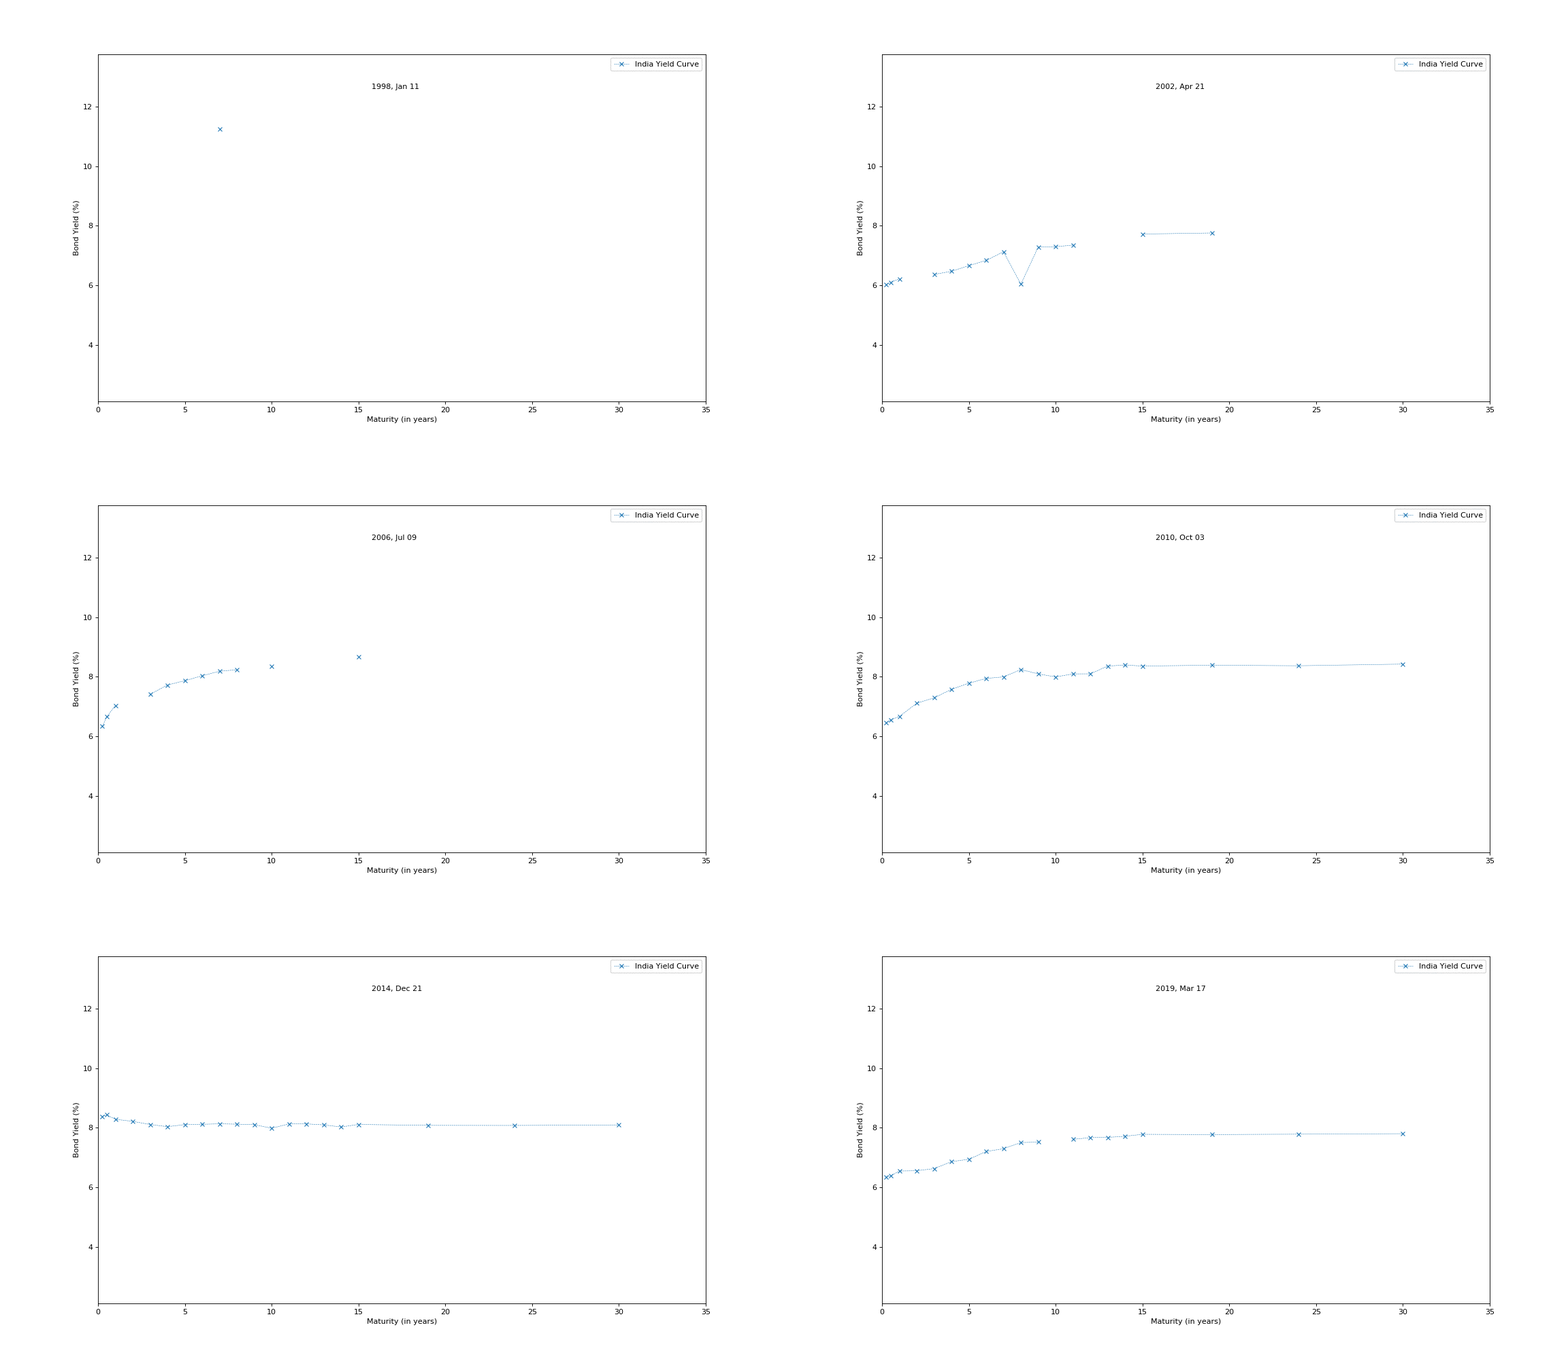
Pretty Neat, isn’t it! Now we have seen how the India Yield curve changed itself over the course of history. But what does it represent. Before, we go into the detail, here is the recap of some of the common traits of Bond Yield Curve.
a. Normal Yield Curve
b. Inverted Yield Curve
c. Flattened Yield Curve
d. Steep Yield Curve.
Now, it is time to understand in detail of what happened at different time intervals to the economy and how the yield curve demonstrated it.
Year 1998 - 2002
There is nothing much to interpret here as we don’t have enough data points. But I would highlight for a fact that the both short term and long interest rate was above 10%.
Year 2002 - 2004
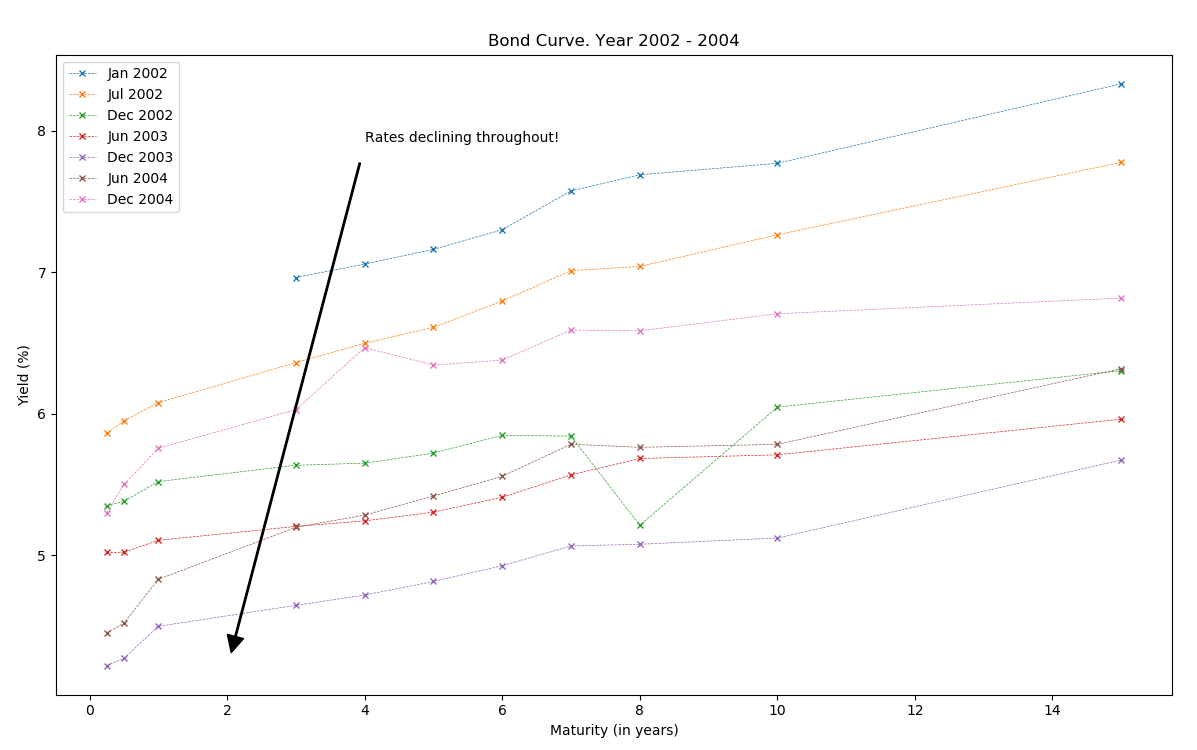
There is an overall downward shift in both the short term and long term bond yields throughout this period. So, what does this imply and what happened here? The short term rates fell from 6% to 5%, quite a significant drop.
Rates decline are usually the steps taken by Central banks to boost up the economy, and/ or to avoid recession, as borrowing money becomes cheap. Consumer spending goes up during these times, further increasing the money circulation in economy. In recent times, we have seen Japan/ EU countries making interest rates below 0%; quite a severe measure, but nonetheless helps revive up the economy. Similar effect it had on Indian economy as well. India GDP growth rate shot from 3.8% to a staggering number of 8%.
Year 2005 - Until Mid 2008
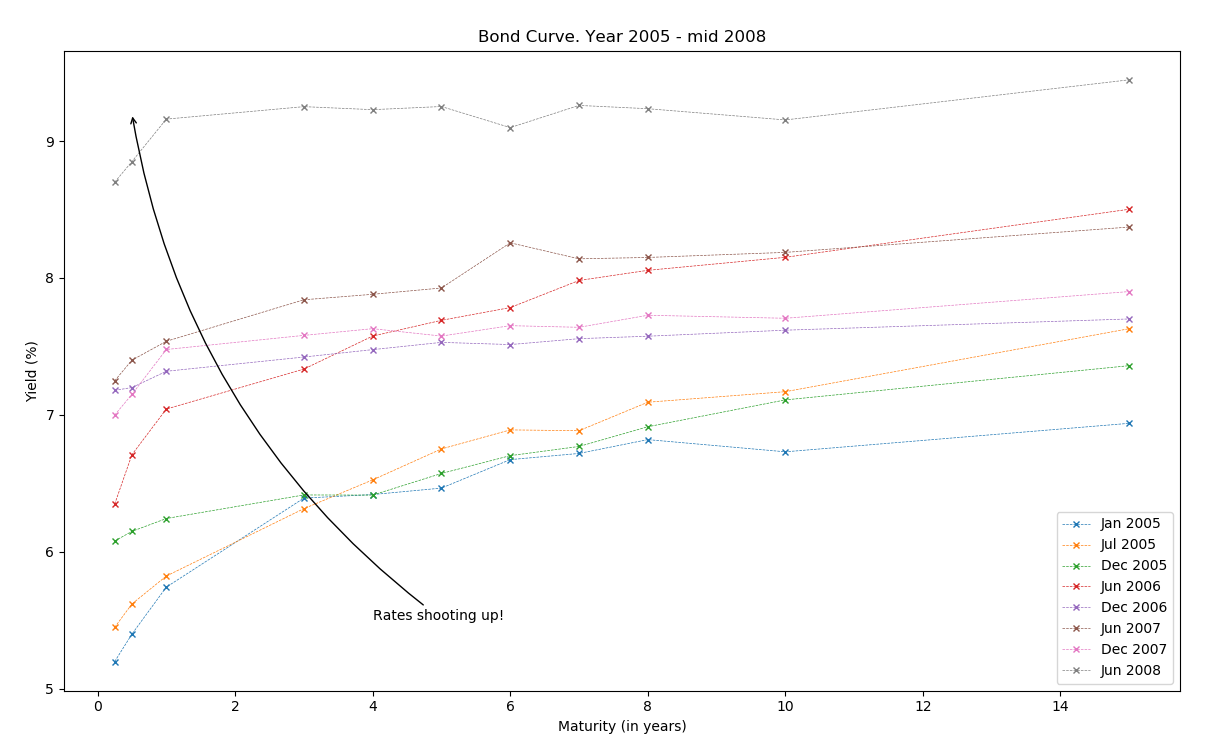
If declining rates are good for economy, then shouldn’t they be just kept low? The answer in no. When rates are low, borrowing becomes cheap, which means debt market shoots up, increasing the overall debt in the economy. This is what happened until 2004. Now, from 2005 until the dawn on Financial crisis, rates kept increasing indicating heavily the sign of highly distressed economy.
In this period, short term rates shot up more than the long term rates indicating Central banks efforts to prevent inflation, which of course was the Financial Crisis of 2008. Long term rates are not driven by the Central bank policies. They provide an overall view of economy on a longer term horizon. During these times, the spending decreases, and savings increases, implying a trouble in the short term.
So, now we know that something bad with economy is about to happen. Too late now, though!
Financial Crisis and recovery (2008 - 2011)
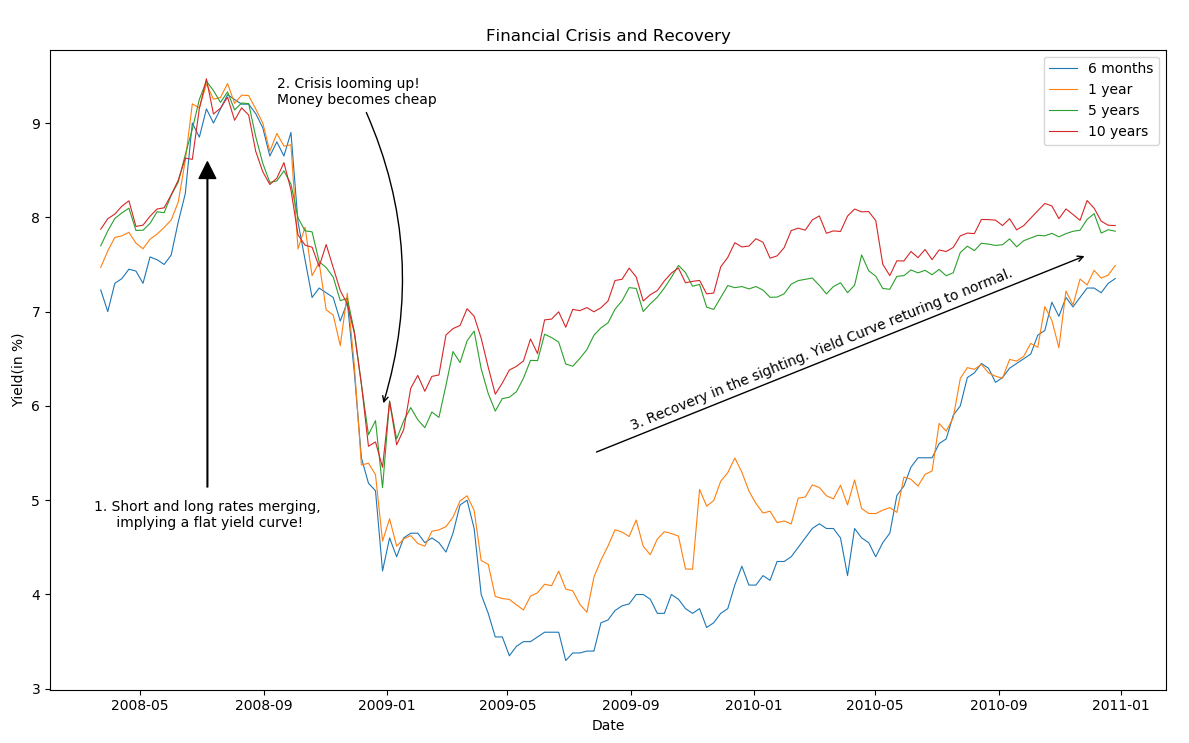
This chart is quite interesting. I have split it in 3 sections, all of which are equally important. This chart highlights the period leading to crisis, the actions/ measures taken during crisis, and the slow recovery thereon.
The period until August 2008. Well, by now, the crisis had almost hit United States, and it had its repercussions globally. Short term rates (6months/ 1 year), they all shot up more in comparison with the long term rates. A classic case of Yield curve flattening. There is a recession in sighting!
Then it struck! A sharp decline in the Bond yields. Money becoming cheap again. A drastic measure taken by Central banks across to handle the crisis. A good measure indeed! Short term rates fell from the highs of 9% to just below 5%, in a matter of few months. That is extreme! Short term rates kept falling, highlighting the Steepening of the yield curve. It was to encourage borrowers to borrow more, boost up the economy, rise back from the ashes, et al! At the end, it was definitely an action worth taking. Across the globe, central banks took significant measures to inject more money into the economy by some or the other way. US reduced interest rates; EU initiates Quantitative easing program and several others.
Over the course of next 3 years, economy tried to recover and come back to normal. Slowly and gradually, rates increased indicating the revival overall. Yield curve returned to its normal shape, not flat, not steep and definitely not inverted!
Curios Case of Inversion this time (2012 - 2014)
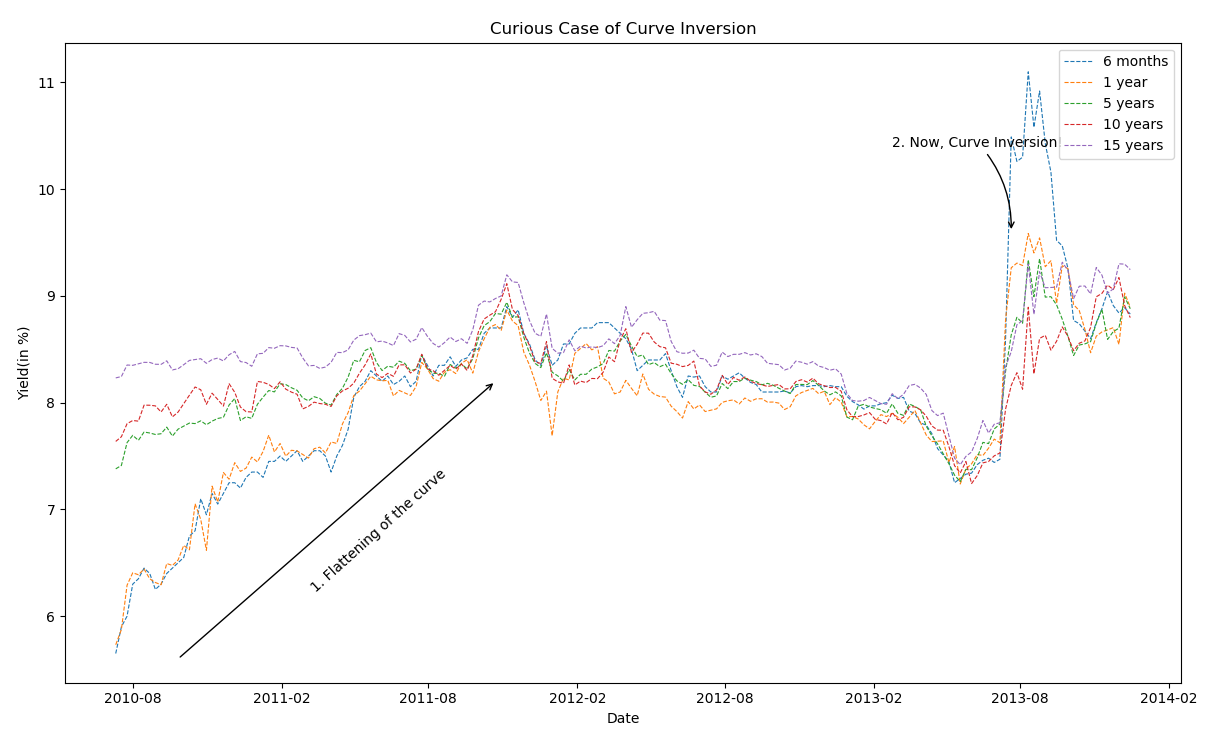
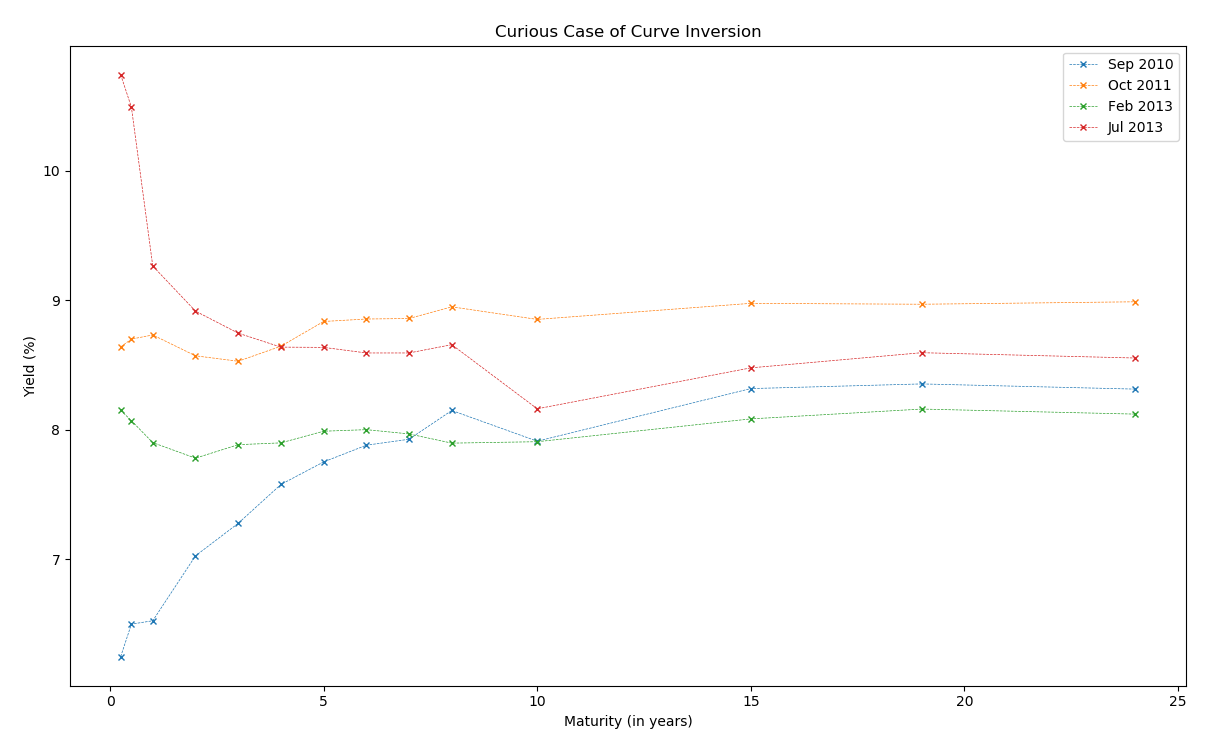
The recovery happened, or so it seems. After returning to its normal shape, India Bond Yield curve danced further to become more flat. Short term rates, again, shot up to coincide with long term rates.
From the Financial crisis, it became quite evident that a crisis is not just limited to the economy in which it is started. This time around, with rising commodity prices, and looming Euro debt crisis, RBI (Central bank authority in India) had to increase short term interest rates over and over again and hence leading to Flattening of the curve again.
The curve remained similar until mid 2013, when suddenly the Curve inversion happened. 6 months bond yield shot up to 11% whereas 10 year Bond was yielding only 9%. An extremely rare scenario! It was a desperate and deliberate attempt by RBI to defend the weak Indian Rupee, thereby making it hard for speculators to sell currency. As Reuters summarised,
The RBI’s strategy of using short-term money markets to defend the rupee seemed ideal. By anchoring long-term yields, the central bank could ensure that its policies to defend the currency were contained at the short end of the yield curve and so did not affect other borrowers and investors in the economy.
Indeed, a very drastic measure taken by RBI.
Returning back to normalcy (2014 - 2016)
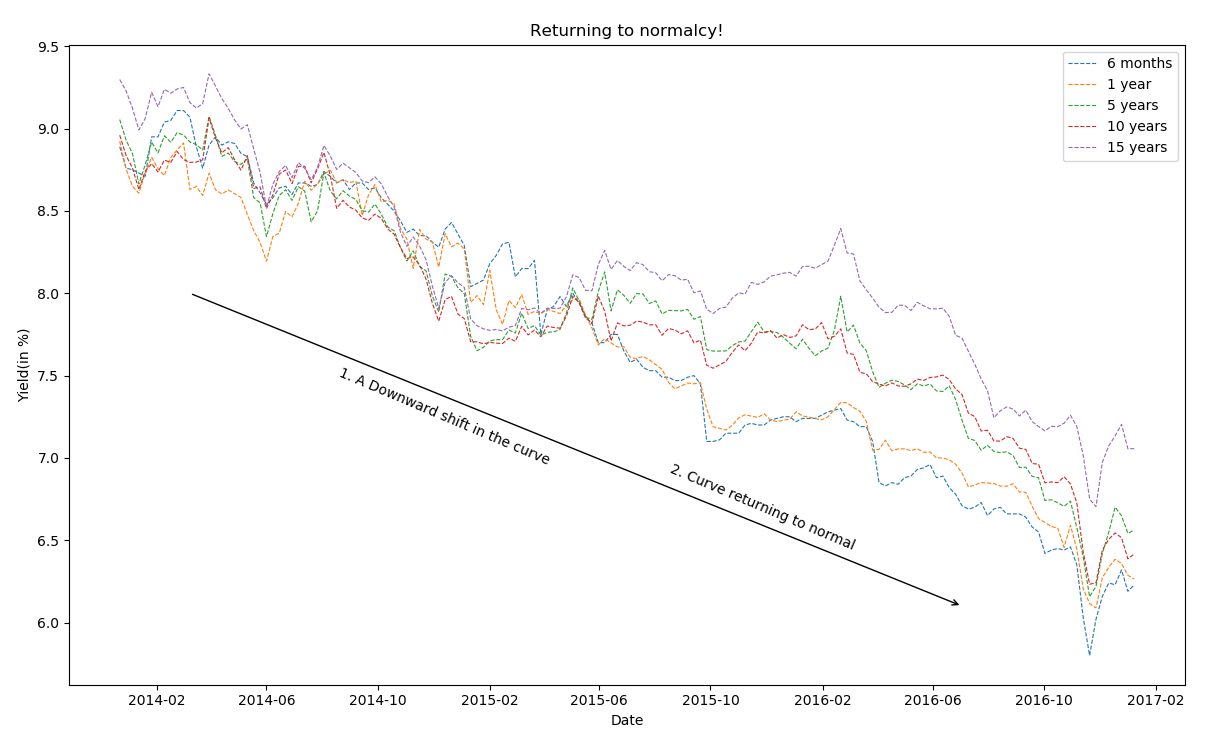
It took some time for the yield curve to change its course. It remained inverted until 2015, but there was a gradual decline in the interest rates across maturities. Across the globe, emerging markets economies were struggling a little bit. With rise in commodity prices, and Oil reaching new highs, emerging market economies tumbled up until 2015. Emerging market currencies weakened against USD. Yield curves remained flat or inverted (in India’s case).
But starting 2016 Indian economy again started to shine, though still in the recovery phase. Both long term and short term yields fell, with short term falling more than long term. Curve had started to return to its normal phase. Some of which could be attributed to Oil prices, as it took a significant hit in the global markets. With India so dependent on Oil, it is inevitable that overall Economy also fluctuates with rise and fall of prices.
Now a days! (2017 - Now)
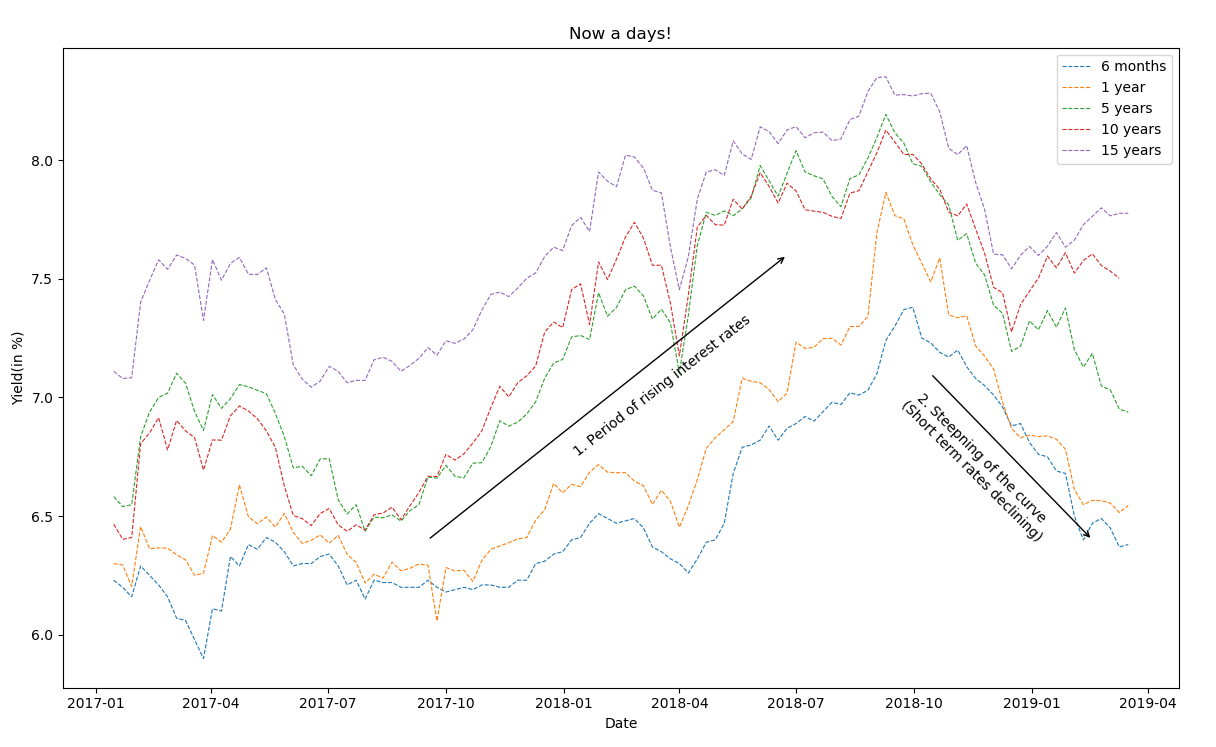
So, what’s happening these days? What can we read from the current yield curve. From 2017 until mid 2018, rates were increasing constantly. I won’t spend too much time here on the reasons here, but it was a sign of rising debts, heavy corporate books, banking books.
As we now know of the Black Friday and the Flash Crash of September, it became evident that there was a bubble in the Indian economy to be burst. In September 2018, the financial crisis in Indian Housing Sector emerged, and it extended itself to other parts of economy as well. With so much at stake, (and upcoming 2019 General elections), Central bank had to constantly lower the rates down to constantly allow borrowers to borrow more at a cheaper rates. Short term rates have gone down significantly when compared with the long term rates, highlighting the Steepness in the Yield curve again. This allows short term financing quite cheap, and hence further raking up the overall debt in the economy.
What Next?
With upcoming General Elections in April/ May 2019, it is rarely likely that the interest rates will change much. Central banks are “Independent”, in nature, and we should expect complete transparency from their behalf on upcoming Monetary policies.
As highlighted above that Long term yields are generally an indicator of economy in the longer run. However, with overall slowing GDP growth, it will be soon that the yield curve reflects this and becomes normal again with Long term rates falling down faster than short term rates.